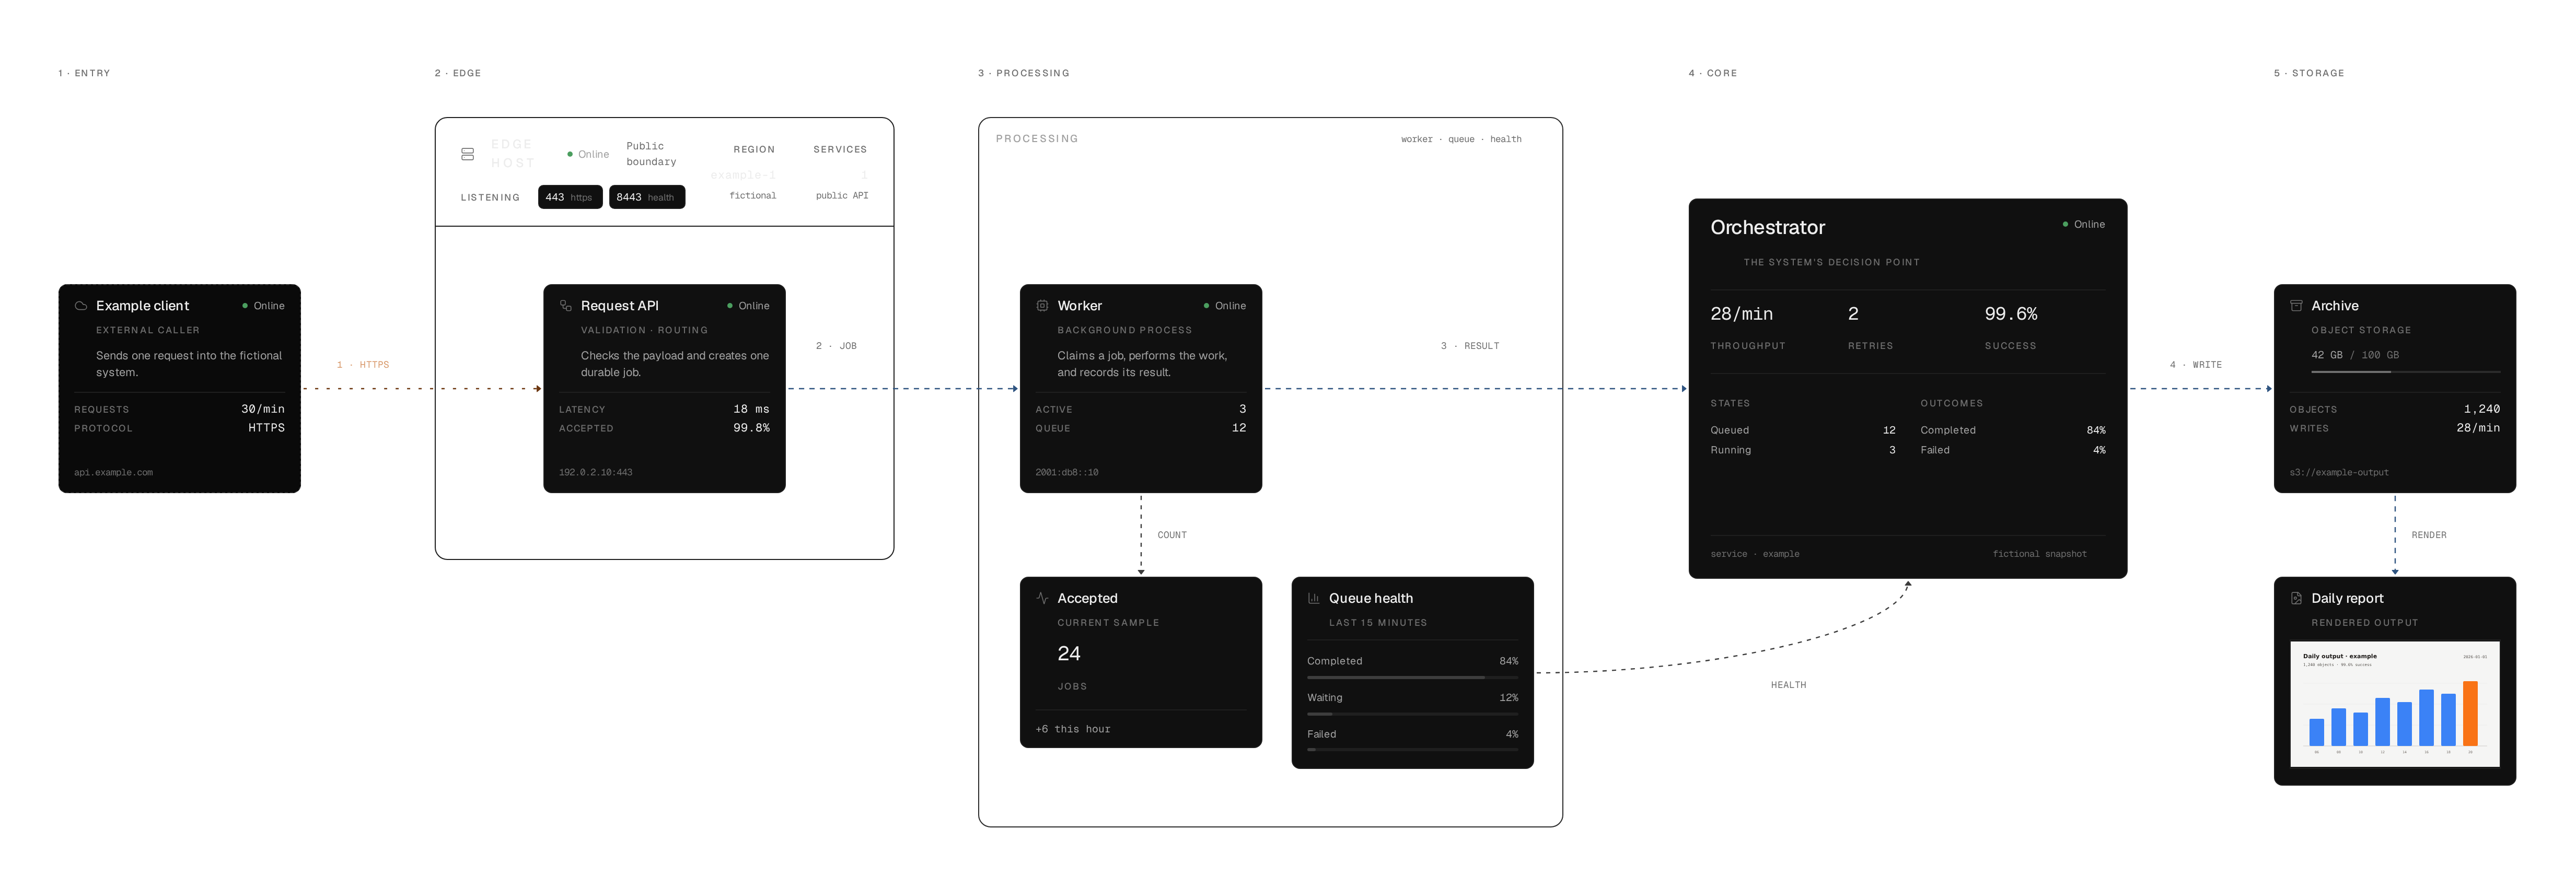
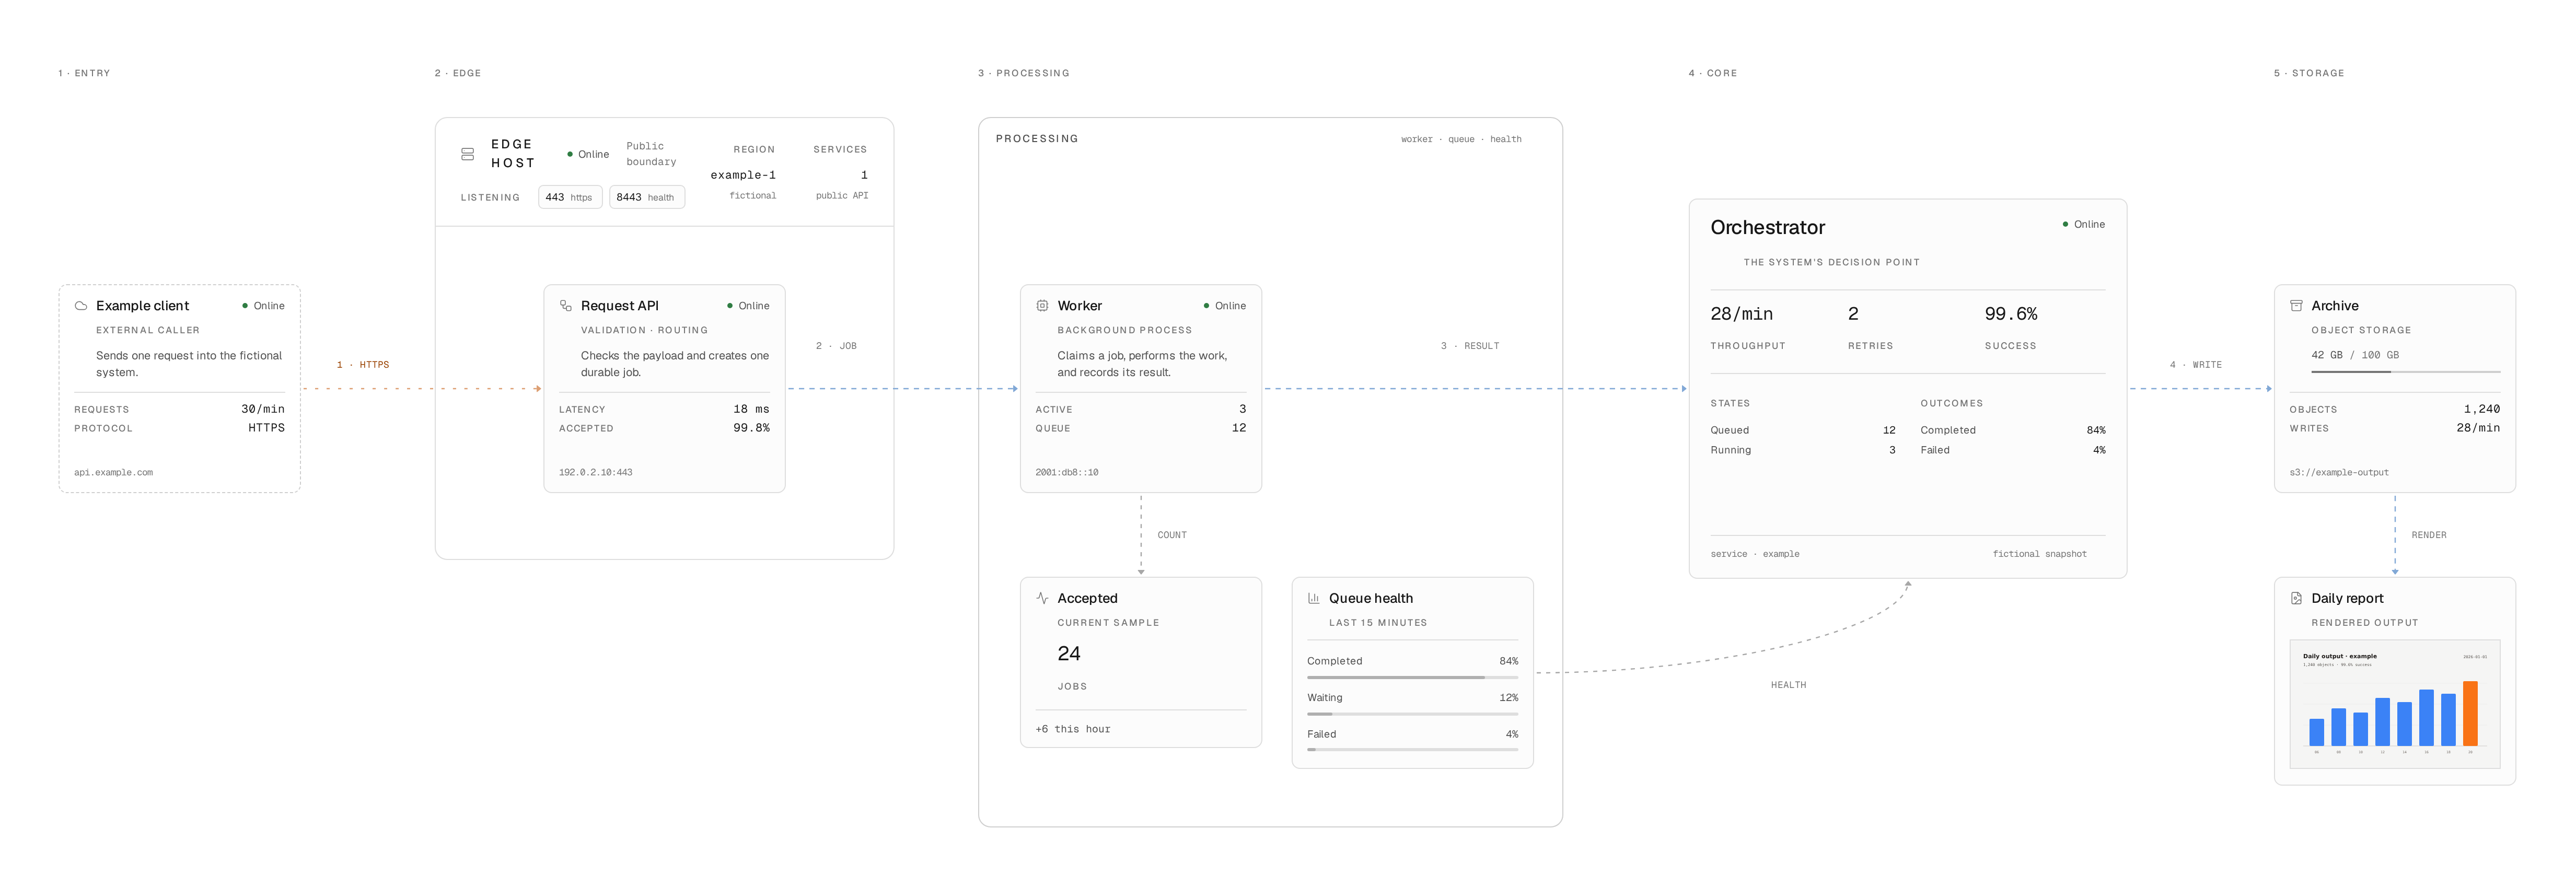
A starter for hand-placed system maps: typed data, cards that say what they are, wires that say what they carry, and the whole canvas exported as PNG or SVG in either theme.
Every graph reduces to one path. This is the example's, with the handoff named on the wire between the steps.
A request, from the caller to a report
HTTPSjobresultwriterender
01EntryExample client
02EdgeRequest API
03WorkWorker
04DecideOrchestrator
05StoreArchive
06ShowDaily report
The trace scrolls sideways on its own
A system you cannot explain is a system you cannot fix. So draw it, wire by wire, from what is actually running.
Four files make a map
Copy data/example/ and app/example/, then edit these. The renderer never imports your data, so a second map costs a folder and a route.
data/example/topology.ts
Who is on the map and where: cards, frames, lanes and the wires between them.
8 cards · 7 flows
data/example/state.ts
The values that change: status, latency, queue depth, capacity.
kept apart from identity
data/example/index.ts
Turns both into React Flow nodes and edges. Sizes live here, once.
no layout engine
data/example/counts.ts
Every number the page and legend print, derived from the topology.
never typed by hand
10 kinds of card
Each one is a React component with a fixed size, so layouts stay on a grid and the audits know what they are measuring.
service
A normal running service
primaryService
The main decision point
external
Something outside the boundary
storage
A path or capacity-bearing store
artefact
The output itself, as a picture
infra
A host frame with listeners and facts
cluster
A labelled frame around related cards
lane
A reading-order label
stat
One derived figure
bars
Ranked values with visible numbers
Node.js 22 or newer. No database, no runtime data source, no account — the example is the whole contract. Drawing with a coding agent? Add the react-flow skill.
npm ci
npm run dev
# http://localhost:3000/example

# optional, for coding agents
npx skills add existential-birds/beagle --skill react-flow